vision not that great")
Over the last month, we’ve been running a quiz designed to gauge how well the denizens of adland know television. As it turns out, there are a few gaps in the knowledge respondents have of the media channel. What’s worrying about this is that media decisions are sometimes made based on personal consumption habits rather than what’s happening in the broader industry.
Time and time again, it’s been shown that ad folk are far from normal – and this has again been shown to be the case in this survey, with many of the responses showing that the reach of television is often underestimated.
A total of 531 people shared their thoughts for the quiz, with results varying across questions.
Here’s a rundown of the results and correct answers for every question (correct answers are shown in bold).
Question 1:
b) dead
Result: 77 percent of respondents correctly answered that TV is having babies.
This phrase is borrowed from the Ad Contrarian Bob Hoffman who says reports of TV’s death are greatly exaggerated: “What is changing is not consumer behaviour. What’s changing is what we call [TV].”
Question 2:
b) 66 percent
c) 86 percent
d) 96 percent
Result: Only 59 percent of respondents knew that 96 percent of New Zealand households have at least one television.
That’s a lot of TVs. And, according to a study by Statistics New Zealand in 2012, watching television and videos is third behind sleeping and working in terms of the amount of time spent.
Question 3:
b) 2.2
c) 3.2
d) Four or more
Result: 64 percent of respondents correctly selected assessed that an overall average 2.2 televisions occupy New Zealand households.
That number is based on 2012 figures, and it’s up from 1.54 in 2000.

Question 4:
b) 44 percent of New Zealanders
c) 64 percent of New Zealanders
d) 84 percent of New Zealanders
Result: Respondents had no problem with this question, with a total of 74 percent answering it correctly.
According to Nielsen, 3.2 million New Zealanders aged 10-plus viewed an average of 23 hours of broadcast TV content through their TV sets across a week in 2015.
Question 5:
b) 53 percent
c) 63 percent
d) 73 percent
e) 83 percent
Result: Things didn’t go quite as smoothly when it came to this question, with only 33 percent of respondents knowing that 83 percent of viewing is done on television.
There seems to be a perception across the industry that New Zealanders are watching less TV than they actually are. But this is to be expected given that adfolk consumption habits differ markedly from those of most New Zealanders.
While adfolk are binge-watching SVOD shows, the average New Zealander consumes the vast majority of their video content through broadcast TV. According to Nielsen, on average New Zealanders watch 193 minutes of broadcast content per day on the TV, while only watching 40 minutes of video content online. And yes these numbers do include YouTube.
Question 6:
b) 50 percent
c) 60 percent
d) 70 percent
e) 80 percent
Result: This was another question that tripped up respondents, with 21 percent correcting correctly selecting option ‘d’. Interestingly, the most popular answer was 80 percent, suggesting that adfolk believe the service to be more widespread than it actually is.
In the middle of 2016 – almost 10 years after it launched – 70 percent of New Zealand homes used Freeview, a year-on-year growth of five percent from 2015.
Question 7:
b) 6
c) 14
d) 21
e) 37
Result: 32 percent of respondents knew (or guessed) that Freeview offers a total of 37 channels across the country.
However, the 39 percent who selected 21 channels as their answer weren’t entirely incorrect either in that some channels are regional. According to Freeview, most locations have access to more than 20 channels.
Question 8:
b) 1
c) 4
d) 7
Result: The respondents correctly tended toward the high numbers with this one, with 49 percent going for the right answer of seven new free-to-air channels (the second most popular choice was four).
New free-to-air channels continue to be launched (or updated), with Duke, Bravo, Bravo +1, HGTV, Fashion TV, NCTV and Wairarapa TV being switched on last year.
Question 9:
b) 25 percent
c) 35 percent
d) 45 percent
Result: The respondents were spot on with this one as 71 percent correctly chose assessed that free-to-air TV reaches an average of 45 percent of New Zealand’s 18- to 39-year-olds every day.
Furthermore, it also reaches 50 percent of 18-49s, 57 percent of 25-54s and 81 percent of the 55+ demographic.
Question 10:
b) Online video (eg YouTube, Facebook)
c) Music (stored, ed iPod, CDs)
d) Music (streamed, eg Spotify, YouTube)
e) Newspaper (including online)
f) None of the above
Result: This one bamboozled 76 percent of the audience. Only 23 percent knew that no channel apart from television maintains its viewership.
The most popular incorrect answer was online video, with 54 percent of respondents selecting this as their answer.
According to NZ on Air’s 2016 study, linear TV is the only media that does not show a decline in reach after 6pm. The daily reach of linear TV from 6pm to 8:30pm is 58 percent, while the next best-performing media, online video via YouTube and Facebook, has a reach of 25 percent.

Question 11:
b) Decreased
Result: The respondents didn’t fall for the trap in this one, with 83 percent correctly saying that Freeview viewing time had increased. But by how much exactly?
According to the 2016 NZ on Air study, time spent per day watching Freeview has increased from an average of 54 minutes in 2014 to 59 minutes in 2016.
Question 12:
b) 24 percent
c) 34 percent
d) 44 percent
e) ‘You get a Smart TV, you get a Smart TV, everyone gets a Smart TV’
Result: This question had the lowest percentage of correct answers, with only 16 percent selecting option ‘b’ (24 percent of households). The most popular answer was a little more on the optimistic side, with 44 percent of respondents going for the biggest number on the list of options.
While the 44 percent mark hasn’t been reached yet, it shouldn’t take too long for us to get there. According to Nielsen, people are interacting with their TV sets more than ever, due to the availability of high-quality on-demand content from free-to-air and paid-for services and games. And that’s leading to big Smart TV growth globally: According to Frost & Sullivan, 221 million were shipped in 2016 and that’s expected to increase to 244 million this year. Suffice to say that the optimism among the respondents wasn’t misplaced at all.
Question 13:
b) False
Result: 65 percent of respondents got this one right.
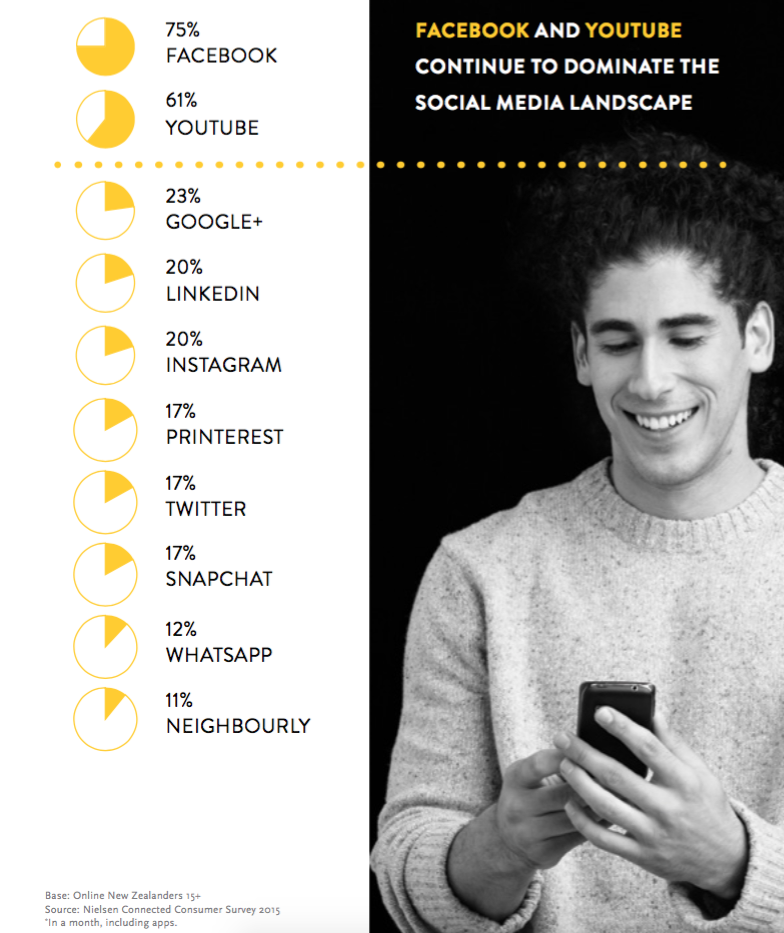
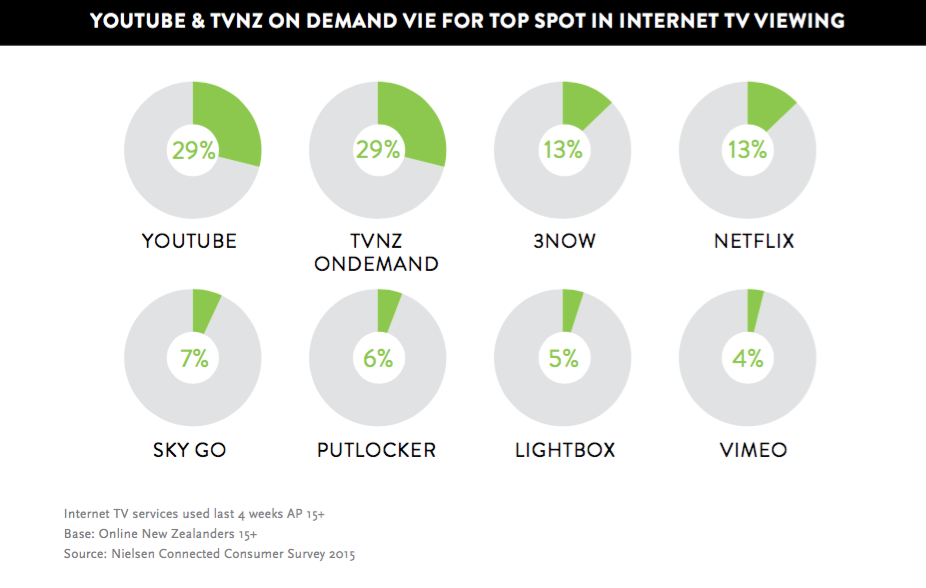
According to Nielsen, TVNZ OnDemand and YouTube had been used by 29 percent of New Zealand survey participants, while ThreeNow and Netflix had been used by 13 percent.
Question 14:
b) Down
c) Remain the same
Result: While this is more of trend-based question, the 44 percent of respondents who anticipate spend will go up have their prediction backed by research.
According to PWC, TV ad spend in New Zealand will grow at four percent, which will send it to a new peak of $748 million in 2020. Terrestrial TV advertising revenue will continue to dominate, taking 76.4 percent of total TV advertising revenue in 2020, passing pre-recession levels to reach a new high of $541 million.
Question 15:
b) Down
c) Remain the same
Result: Interestingly, a higher percentage of users predicted that TV ad spend will increase in the global market, with 61 percent correctly selecting option ‘a’.
According to Magna, TV ad sales were up four percent to US$186 billion in 2016. And according to WPP’s GroupM, TV will remain dominant this year, predicting that it will hold 41 percent of the global pie compared to 33 percent for digital.
Question 16:
b) 40/ 60
c) 50/50
d) 60/40
e) 70/30
Result: Only 31 percent of respondents correctly selected the 60/40 option. Interestingly, the most popular choice was heavily weighted in favour of short-terminism, with the 30/70 option attracting 40 percent of the vote.
Field has analysed decades worth of case studies to chart the course to effectiveness. And he’s worried about the rise of short-termism in business and the appeal of sugary activation metrics like search or social over long-term brand building – most powerfully seen with emotional rather than rational video campaigns.
Question 17:
b) False
Result: 74 percent of respondents were correct in placing the social media company as the biggest new advertiser on television in the UK in 2015.
According to the Sydney Morning Herald, “Facebook contributed £10.8 million in ad revenue – the most of the 877 new advertisers or those returning to TV after not spending for at least five years.” Google, Netflix and other online businesses were not far behind and helped TV ad spend in the UK reach a new record that year of £5.27 billion, up 7.4 percent, in 2015.
Question 18:
b) Having babies
Result: By the end of the survey only six percent of respondents remained unconverted. The other 94 percent, however, agreed that the channel is having beautiful bonny wee babies.


