
Get the latest direct to your inbox twice a week. Sign up today. 
Industry responds to ASA decision to pull out of releasing ad spend figures—UPDATED

The ASA will not be releasing its annual ad spend figures this year, breaking the annual tradition of providing a snapshot of how the various channels performed over the course of the year.
“In a world where many media companies are operating across platforms, a sector breakdown of media revenue has become more complex,” explains ASA chief executive Hilary Souter. “A number of sectors release their own figures and the ASA has agreed it is time to step away from providing this service.”

Souter says the ASA has been reporting on these numbers for around 20 years, but it was becoming more and more difficult to report accurately in a fragmented world.
“When things change, you can adapt, but sometimes you have to accept that what you offer is no longer fit for purpose,” Souter says.
It’s understood some of the industry bodies could not reach a consensus on the reporting methodology.
Because of the blurring of lines between the various channels, it has become more difficult to determine where spend should be allocated.
This problem is most pronounced when it comes to digital spend, in that all major media companies today also generate revenue from their digital properties. And for the ‘traditional’ sectors, when the numbers are going down—and with accounting for new revenue streams—it creates a negative perception in the market that might not be based on reality.
In the past, this has led to double-reporting of some figures, with spend being allocated in digital as well as another channel.
Everything feeds into digital
For media owners categorised in a specific category, it can be frustrating to see revenue generated through their online properties allocated to the interactive category.

NZME chief commercial officer Laura Maxwell believes this kind of reporting has lost relevance in a fragmented industry.
“Most media owners now have multiple revenue streams that sit outside discrete inventory pools and so putting these back into a box for an annual report that defines revenue by advertising inventory, is no longer relevant in 2016,” Maxwell says.
“The industry groups have chosen to report digital into their own channels, when in 2014 and for all of 2015 in the IAB reports, this was reported as digital. So an ASA report by channel will no longer be reliable due to double-counting.”
However, Maxwell does still see broader, industry-wide relevance in reporting the figures.
“The purpose of the report was not to evaluate the size of each media company; it was to show what channels advertisers had chosen to put revenue against. Globally, this is a media market measure and it’s important to show where budgets are being spent. Industry groups can highlight the digital revenue growth within their channels independently.”
Bauer chief executive Paul Dykzeul says that in the past all the categories had a single, direct source of revenue, but this isn’t the case anymore.

“If you look at something like NZME, they are earning revenue from all over,” Dykzeul says. “They are active in radio, print, digital, video and a range of other platforms. And the same could be said for any other media company.”
For this reason, the Magazine Publishers Association has consolidated its revenue figures across all platforms, rather than attributing its digital earnings to the interactive category.
This certainly does make sense, given that teams behind the print publications also manage the online properties of their titles.
Dykzeul also questioned the purpose of reporting the figures at all, given that they don’t serve any strategic purpose.
“I don’t think anyone looks at the figures and makes a decision based on where the most money is being spent,” Dykzeul says.
At best, he believes the ASA figures serve as bragging rights for the sectors that have had a good year.
Dykzeul admits “a bit of gloating” has always been part of the industry, but adds it doesn’t make sense for the interactive sector to trumpet its performance when at least some of that growth is coming from spend generated in the traditional channels.
Dykzeul says he does not know what the best course of action would be to ensure the numbers provide an accurate reflection of the industry. He points out that SMI arrived in the market claiming to offer a solution by collecting ad spend data from big media agencies, but that also has flaws, he says, particularly the fact that direct spend, a growing part of many media businesses, isn’t accounted for.
Industry disappointment
Despite the general consensus that the numbers weren’t accurate, some industry heads expressed disappointment about the fact that the ASA was no longer reporting the numbers.
ANZA chief executive Lindsay Mouat says that while the data might not be 100 percent accurate, it does provide a guide in terms of how the industry is evolving.

“This data provides our best snapshot of the economic importance of the advertising sector,” he says.
“We are an industry under increasing regulatory threat, globally and locally, but we are also an industry of nearly $2.5 billion with a substantial multiplier effect, which generates growth and underpins a competitive, innovative market.”
Mouat says it would be unfortunate to lose this industry data set because of competitive tension.
“We understand that this decision results from some media organisations being unable to agree how digital ad expenditure is reported and the risk of then double-counting,” Mouat says.
“Given the cross-platform nature of media and the multiplicity of channels this has provided challenges, but they should not be insurmountable.”
Mouat also believes that steps toward greater accuracy have been taken over the last year.
“These issues were addressed 12 months ago, when the segmentation of ad data was reviewed and a revised reporting mechanism in place. It seems extraordinary this solution hasn’t survived the year.”

This disappointment is also shared by IAB chief executive Adrian Pickstock, who says that figures do play an important role in the industry.
“The report is an important tool for advertisers and media owners – reflecting the size of the New Zealand advertising industry and, most importantly, indicating the shift of advertising spend across the various media platforms.”
Wayne Chapman, chair of OMANZ, which released some very positive figures for the outdoor industry recently, shares these sentiments.

“I think it’s a little bit embarrassing for New Zealand quite frankly,” he says.
“I understand it can’t have been an easy decision to take, but from my point of view it’s very disappointing not to have a whole of market view to understand what the advertising turnover trend has been in the previous 12 calendar months.”
Chapman also said that he was going to approach Souter to find an alternative means by which to report figures in the future.
“I’m going to contact the outdoor operators, who are not members of OMANZ, but who submit figures to Hillary to see of there is appetite to provide an alternative system to collate those figures independently so that they are comfortable with the security around their numbers,” he says.
“Because I think it’s very important that ongoing trends are continued to be monitored and I think there’s value in that data.”
Rob Hoar, the general manager of Think TV, says the TV industry also decided to release its data because it provides a useful indication of spend trends in the industry.

However, he says he understands where the ASA is coming from.
“If the data was no longer accurate, then the ASA would’ve put its reputation at risk by releasing it,” Hoar says.
While there is currently little consensus about the best approach to reporting on the figures, Hoar adds that he would like to see annual reporting for ad spend figures resurrected in the future.
But finding an organisation—or even a person—willing to do job after the ASA is easier said than done.
“I’m not sure who would be willing to pick up that poisoned chalice,” Hoar says.
Last year, the major broadcasters came together to include digital video within the TV bucket, and claimed that this revenue stream (around $20 million) made up for the decline in traditional TV ad revenue.
Independent releases
While the ASA will not be providing the full picture of spend data, some of the sectors in the industry have reported their numbers independently:
- Interactive: $800 million
- Television: $621 million
- Magazines: $210 million
- Outdoor: $80 million
- Newspaper media: $497 million
StopPress is still waiting for figures from other sectors.
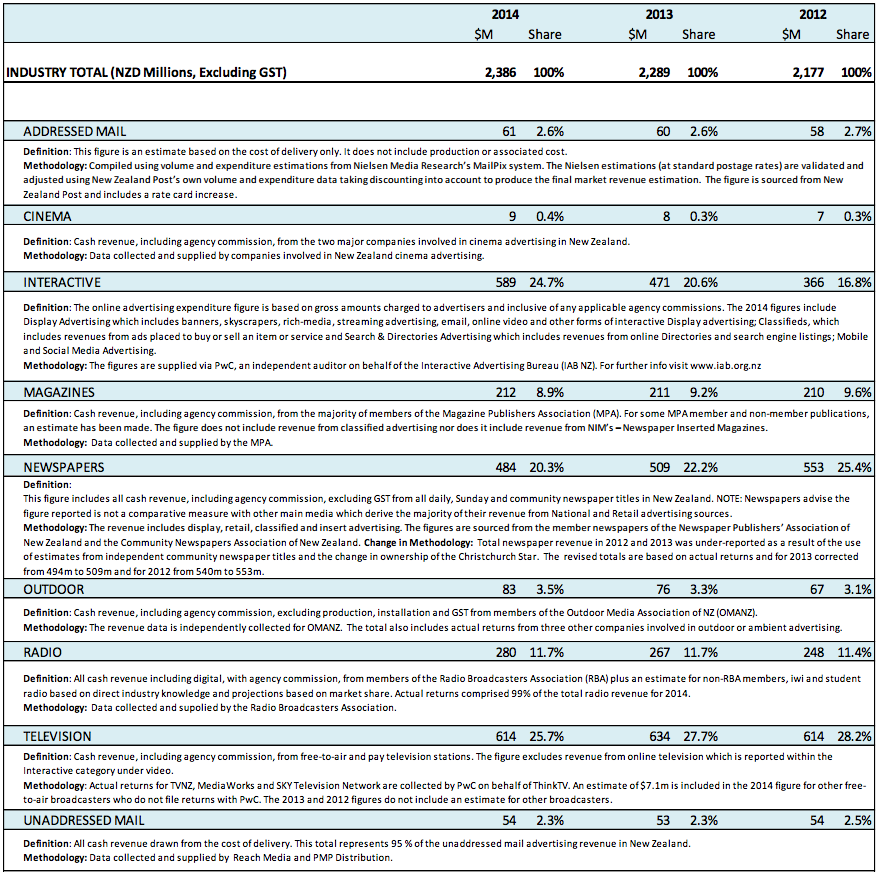
Here are figures from previous years for comparison:
Update:
Newspaper Publishers Association chief executive Brian Hill said in a statement following the ASA’s decision that the report provided a useful snapshot but may have lost some relevancy given the changing media landscape.

“The market has moved on, where in the past most media owners had one source of advertising revenue, the reality today is that many have multiple revenue sources which challenges the traditional definitions of spend,” he says. “We still believe it’s important for industry sectors to report their annual figures and do so with consistency.”


